Himanshu Laddhad

About

I am a data scientist and analytics engineer with three-plus years across enterprise analytics and AI engineering, holding an MS in Business Analytics and Information Management from Purdue.

My work has followed one line: get the numbers right, then get them used. Most of it has been in validation, quarantine rules and the unglamorous plumbing that decides whether a forecast reaches a procurement desk at all.

Read the full story
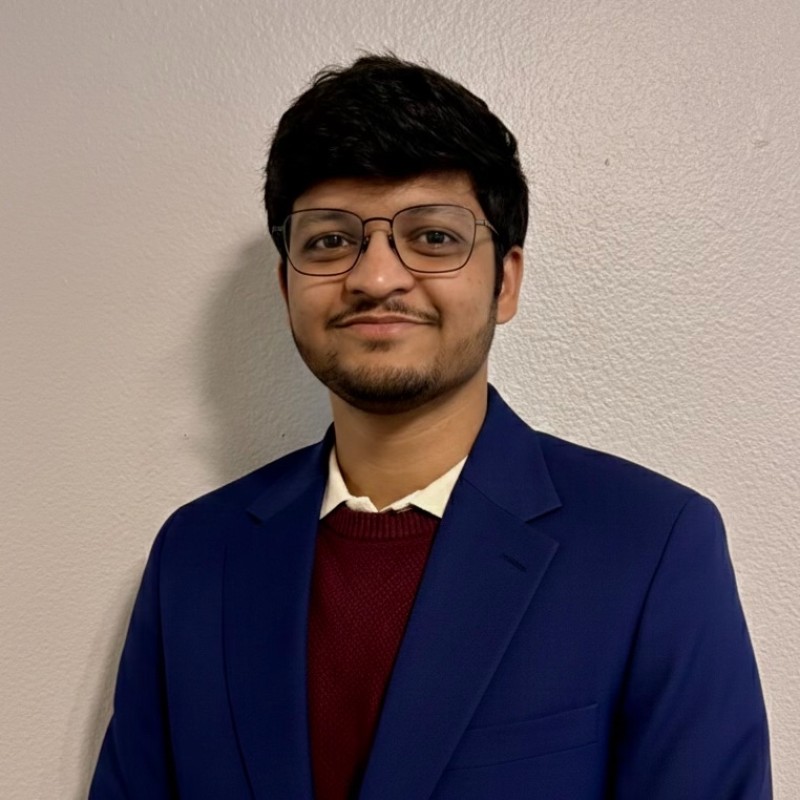
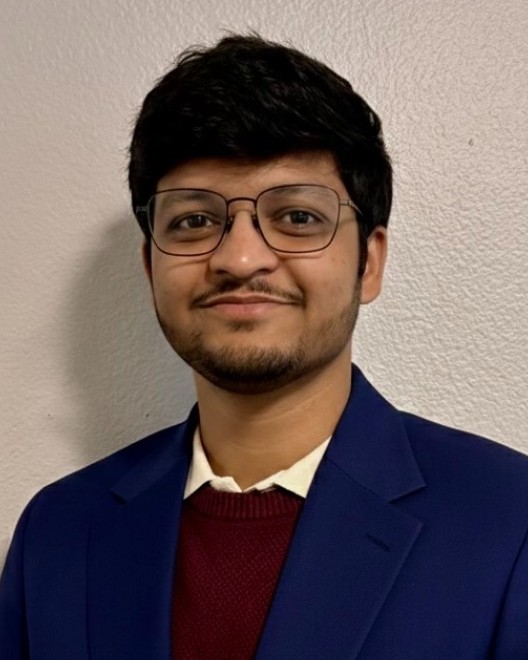
Portrait
4:5

Professional Journey

Building a single data mapping by hand took an estimated three to five weeks. I led a team of five through a nine-week proof of concept: a retrieval-grounded pipeline that drafts new mappings from 400+ existing ones, then a small in-house model set against GPT-4.1. I presented the trade-off to leadership as it was, 68% valid first try against 78%, in exchange for keeping partner data private, rather than claiming parity.

  • Cut mapping build time from PartnerLinQ’s estimated 3–5 weeks to 3–4 hours in a proof of concept (POC) by building a RAG pipeline over 400+ existing XSLT mappings, with GPT-4.1 tool-calling and Groq routing.
  • Presented the team’s model comparison to PartnerLinQ leadership: a small in-house Qwen model (QLoRA) reached 68% first-try Altova validity against GPT-4.1’s 78%, a trade-off that keeps partner data private.
  • Led a team of five over 9 weeks, handing engineers the code, report and a Streamlit test harness to build a chat assistant.

The mandate was open-ended: modernise how the business used its operational data, with no predefined scope. I drew the boundary myself, owning the pipeline and the KPIs built on it rather than claiming ownership of upstream systems I could not enforce. The decision I would defend hardest is that failing rows are set aside under a labelled reason code, never dropped, because a missing record is not a clean record.

  • Gave 10+ users one trusted source for four event streams with an automated ETL pipeline on Databricks, replacing manual consolidation.
  • Kept KPIs clean without manual runs by running dbt models and tests through Airflow (task dependencies, automatic retries, failure alerts), with failing rows set aside under labelled reason codes.
  • Contributed to a ~75% drop in recurring quality exceptions by ranking functions with EDA in Power BI to target engineering fixes.
  • Gave engineering and quality the cause behind problems on request, pulling an affected item’s history across the four streams and checking when it began, so fixes were permanent instead of repeat workarounds.
  • Saved 20+ hours a week of manual reporting by gathering KPI requirements from 3 cross-functional groups and building the Power BI data model, dashboards and KPI documentation for 9 KPIs, training users along the way.

Planning ran on spreadsheet moving averages fed by a single source, and an earlier attempt to patch it had stalled. My manager handed it to me because I questioned the assumption rather than the tool. I proposed a rebuild instead of a patch, proved it on one product line in a two-week parallel run, and only then asked for full commitment. Later I added a daily dashboard so supply surprises became same-day schedule decisions. When a stale input produced silently wrong forecasts, I flagged it the same day and put freshness checks in front of procurement. The teams that had been most sceptical trusted the system more afterwards.

  • Led 3 people in moving forecasting from Excel to an XGBoost model (500+ SKUs), sending slow-moving SKUs to a trailing annual average, cutting forecast error 18% and excess and shortage stock.
  • Translated SKU forecasts into monthly demand per component with a Python job, lifting on-time delivery from under 95% to about 98%.
  • Turned supply surprises into same-day schedule decisions with a daily production dashboard for the operations and supply chain standup (quality joined when needed): time-by-time plan, status and alerts for every department.
  • Instituted freshness checks that stop stale inputs reaching procurement (est. $5K–$20K per incident) and weekly forecast-vs-orders checks.
  • Compared scenarios with a linear optimization model in Excel with Analytic Solver to reorder urgent sales orders when shortages left 20% of priority orders unfulfilled; operations reworked that week’s plan, cutting the figure to 8%.

A short, focused internship, and where I first learned that most of the loss in a process concentrates in a handful of exception modes, provided the data is clean enough to rank them honestly.
  • Helped the operations team focus fixes where they mattered, projecting a 10% process efficiency gain.
  • Ranked 140+ exception categories by frequency using Pareto analysis in Python on 9 months of operational time-series data.
  • Supported corrective-action tracking across procurement, quality assurance and operations; the team reported exception frequency down about 90% and reprocessing rate down 14%.

Featured Work

Causal Promotion Intelligence project artwork
Causal inference

Causal Promotion Intelligence

Stop discounting sure buyers.

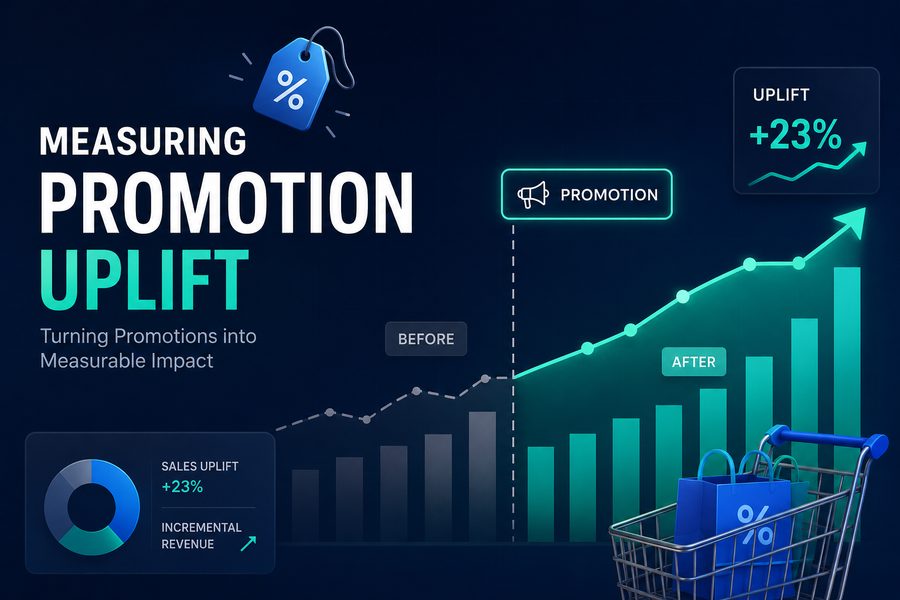
Most promotions get credit for sales that would have happened anyway. This separates real lift from coincidence by running uplift models on A/B test data, then segments customers by how much a discount actually moves them, so budget follows behaviour.

Retail Review Intelligence project artwork
Natural language

Retail Review Intelligence

Every review, read for you.

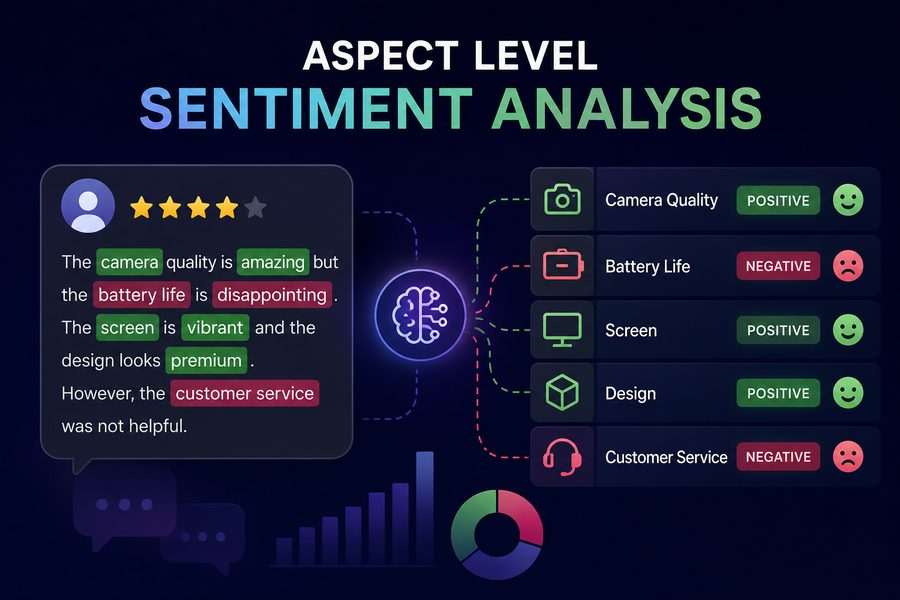
A star rating hides what people actually liked. This reads each review aspect by aspect, scoring sentiment with a fine-tuned DistilBERT benchmarked against simpler baselines, and highlights the exact words behind every call so nothing is a black box.

Conversational XSLT Mapping Agent project artwork
Agentic systems

Conversational XSLT Mapping Agent

Fix data mappings by just asking.

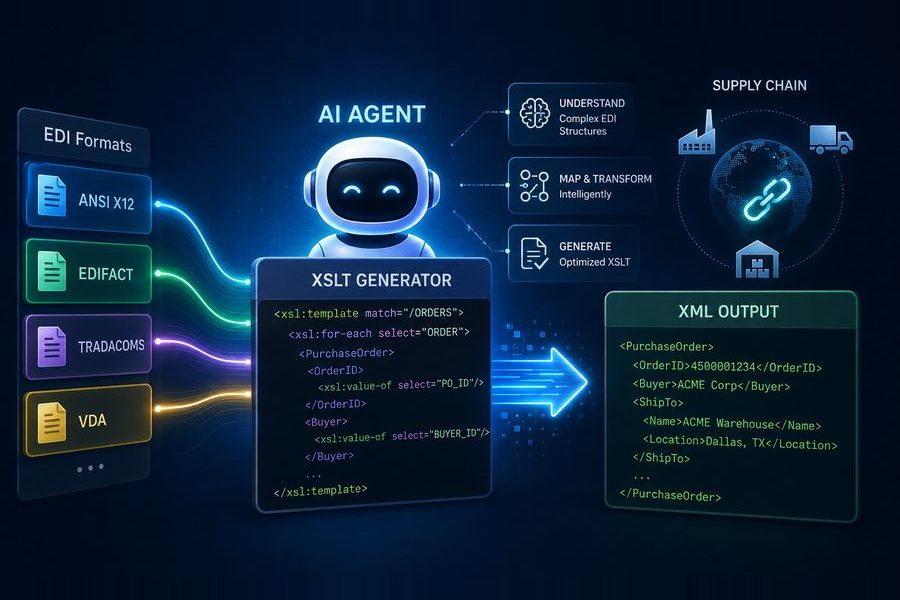
Changing an integration mapping usually means a developer digging through XSLT. Here you describe the change in plain English: the agent retrieves the relevant files, simulates the result, and only edits a file after exploring it, with every change auditable.

Churn and Lifetime Value Intelligence project artwork
Predictive modelling

Churn & Lifetime Value Intelligence

Save the customers worth saving.

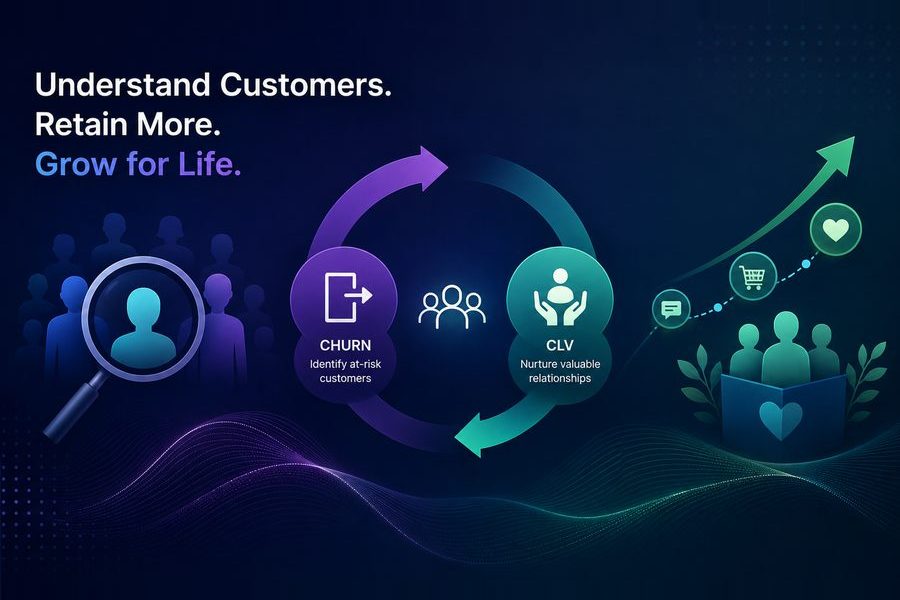
Knowing who might leave isn’t enough; you need to know who is worth keeping. Features built from 410M log rows across 6.7M subscribers feed churn and lifetime-value models, and an expected-value layer merges both into one retention decision.
BankCheck project artwork
Data product

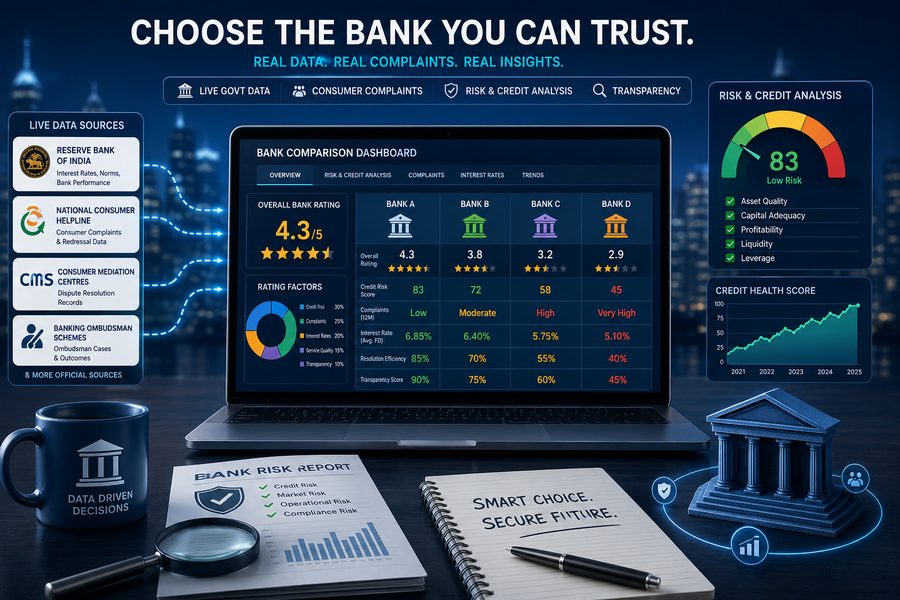
BankCheck

Bank rankings with no sales pitch.

Most comparison sites earn money from the accounts they recommend. BankCheck grades US banks and credit unions using only federal data, from FDIC and CFPB sources, so no affiliate incentive sits behind the ranking. It runs as a live Streamlit app.
PrepStack project artwork
LLM application

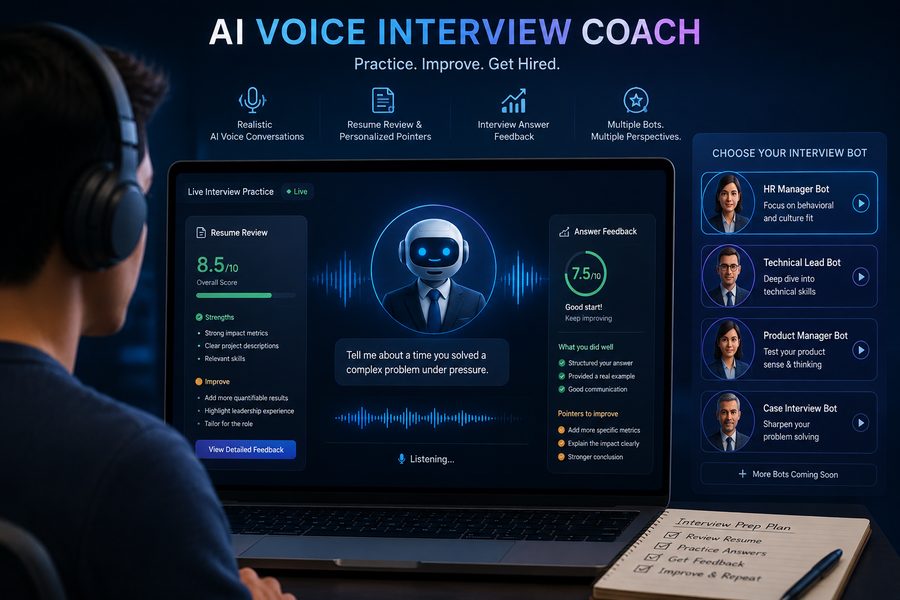
PrepStack

Practice interviews, minus the nerves.

A mock-interview and resume-review coach for any hour. Each phase of the conversation goes to whichever of three language models is strongest at it, trading cost against quality, so feedback stays sharp without a heavyweight model throughout.

Further repositories

Education

2025–26

MS, Business Analytics & Information Management

Purdue University, Daniels School of Business · GPA 3.7

Graduate teaching assistant for AI for Business. Coursework across causal inference, machine learning, data management and analytics strategy.

2019–23

BTech, Mechanical Engineering

Sardar Vallabhbhai National Institute of Technology, Surat · GPA 3.6

Where the habit of tracing a system back to its first principles started, and the reason I still reach for the underlying mechanism before the model.
Skills

Languages & core tools Analytics engineering & platforms Analytics, BI & experimentation Machine learning & AI
SQL Python PySpark Pandas NumPy Excel Git DuckDB ETL pipelines Apache Airflow dbt Kafka Databricks Snowflake BigQuery AWS Microsoft Azure Data warehousing Data modelling Data quality Power Automate Power BI Tableau Data viz EDA KPI reporting RCA A/B testing Causal inference Forecasting Machine learning scikit-learn Regression SHAP MLflow RAG LangChain LangGraph LLM APIs LLM evals

Certifications & awards

Certifications

Machine Learning Foundations

AWS Academy Graduate · 2026

Data Scientist Associate

DataCamp · 2024

SQL Associate

DataCamp · 2024

Certified Cloud Practitioner

Amazon Web Services · CLF-C02

Azure AI Fundamentals

Microsoft · AI-900

Desktop Specialist

Tableau

Awards and Affiliation

  • 2026

    Graduate Teaching Assistant, AI for Business

    Purdue University · Summer 2026

  • 2026

    Undergraduate TA, Six Sigma and Analytics

    Purdue University · Spring 2026

  • 2025

    Excellence in Planning and Efficiency

    JCB India

  • 2024

    Rising New Joinee Award

    JCB India

  • 2021–22

    Research Intern, EV market landscape

    Indian Institute of Management, Ranchi

Writing

Let’s connect.

Graduated August 2026 and currently on OPT, authorised to work in the US now. Looking for opportunities in data science, analytics engineering and AI.

himanshuladdhad11@gmail.com